More Blog & Articles
Explore More Articles


Get in touch
Ready to Scout Smarter and Save More
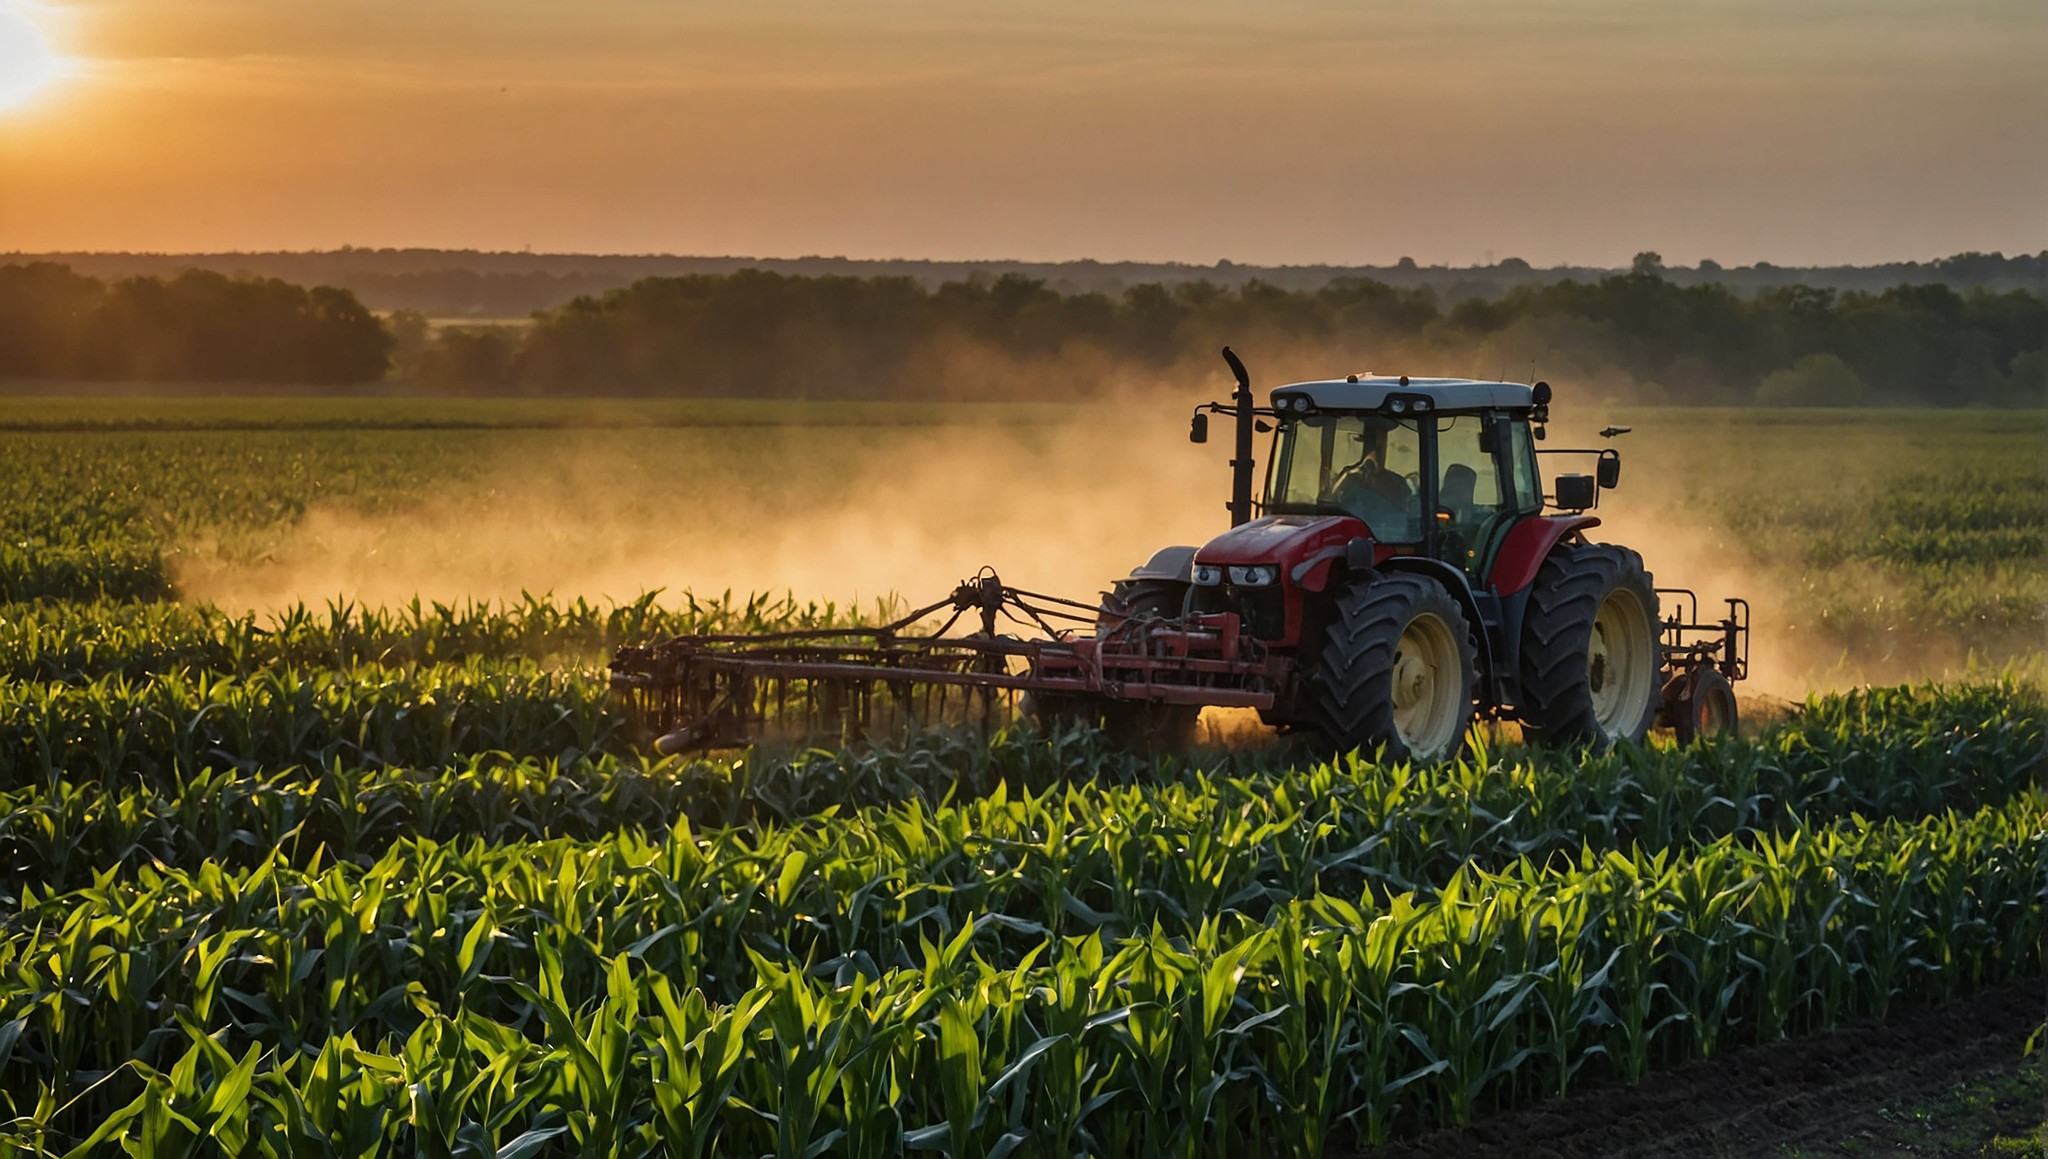
Understanding NDVI Maps and What They Mean for Your Crop
Drone Technology
Julian Chacon

What Is NDVI and Why Should You Care
NDVI stands for Normalized Difference Vegetation Index. It is a measurement that uses near-infrared and visible light reflected by plants to assess crop health. Healthy vegetation absorbs most visible light and reflects a large portion of near-infrared light. Stressed or sparse vegetation does the opposite.
When a multispectral drone like the DJI Mavic 3M flies your fields, it captures both visible and near-infrared imagery simultaneously. Software then processes those bands into an NDVI map where every pixel gets a value between negative one and positive one. Higher values mean denser, healthier vegetation. Lower values indicate bare soil, stressed crops, or weed-dominated zones.
Reading Your NDVI Map
Most NDVI maps use a color gradient. Dark green areas indicate the healthiest, most vigorous crop canopy. Light green to yellow zones suggest moderate stress or thinner stands. Red and brown areas flag serious problems — bare ground, heavy weed patches, nutrient deficiency, or disease pressure.
The key is not just seeing the colors but knowing what to do with them. A red zone in your wheat field might mean waterhemp has taken over that corner. A yellow band running through soybeans could indicate a compaction line from last season. NDVI tells you where to look — ground-truthing and AI analysis tell you why.

NDVI mapping gave us a clear picture of crop health across 800 acres in a single flight. We could see stress zones we never would have caught on foot.
From NDVI to Prescription Map
At Citadel Drones, we take your NDVI data one step further. Our AI pipeline classifies weed species, maps density zones, and generates a prescription map your variable-rate sprayer loads directly. You get a shapefile showing exactly where to apply herbicide and at what rate — no guesswork, no waste.
NDVI is the foundation of precision agriculture. Understanding what your map is telling you is the first step toward cutting input costs, improving weed control, and making smarter decisions for every acre you farm.
