More Services
Explore Other Services
Get in touch
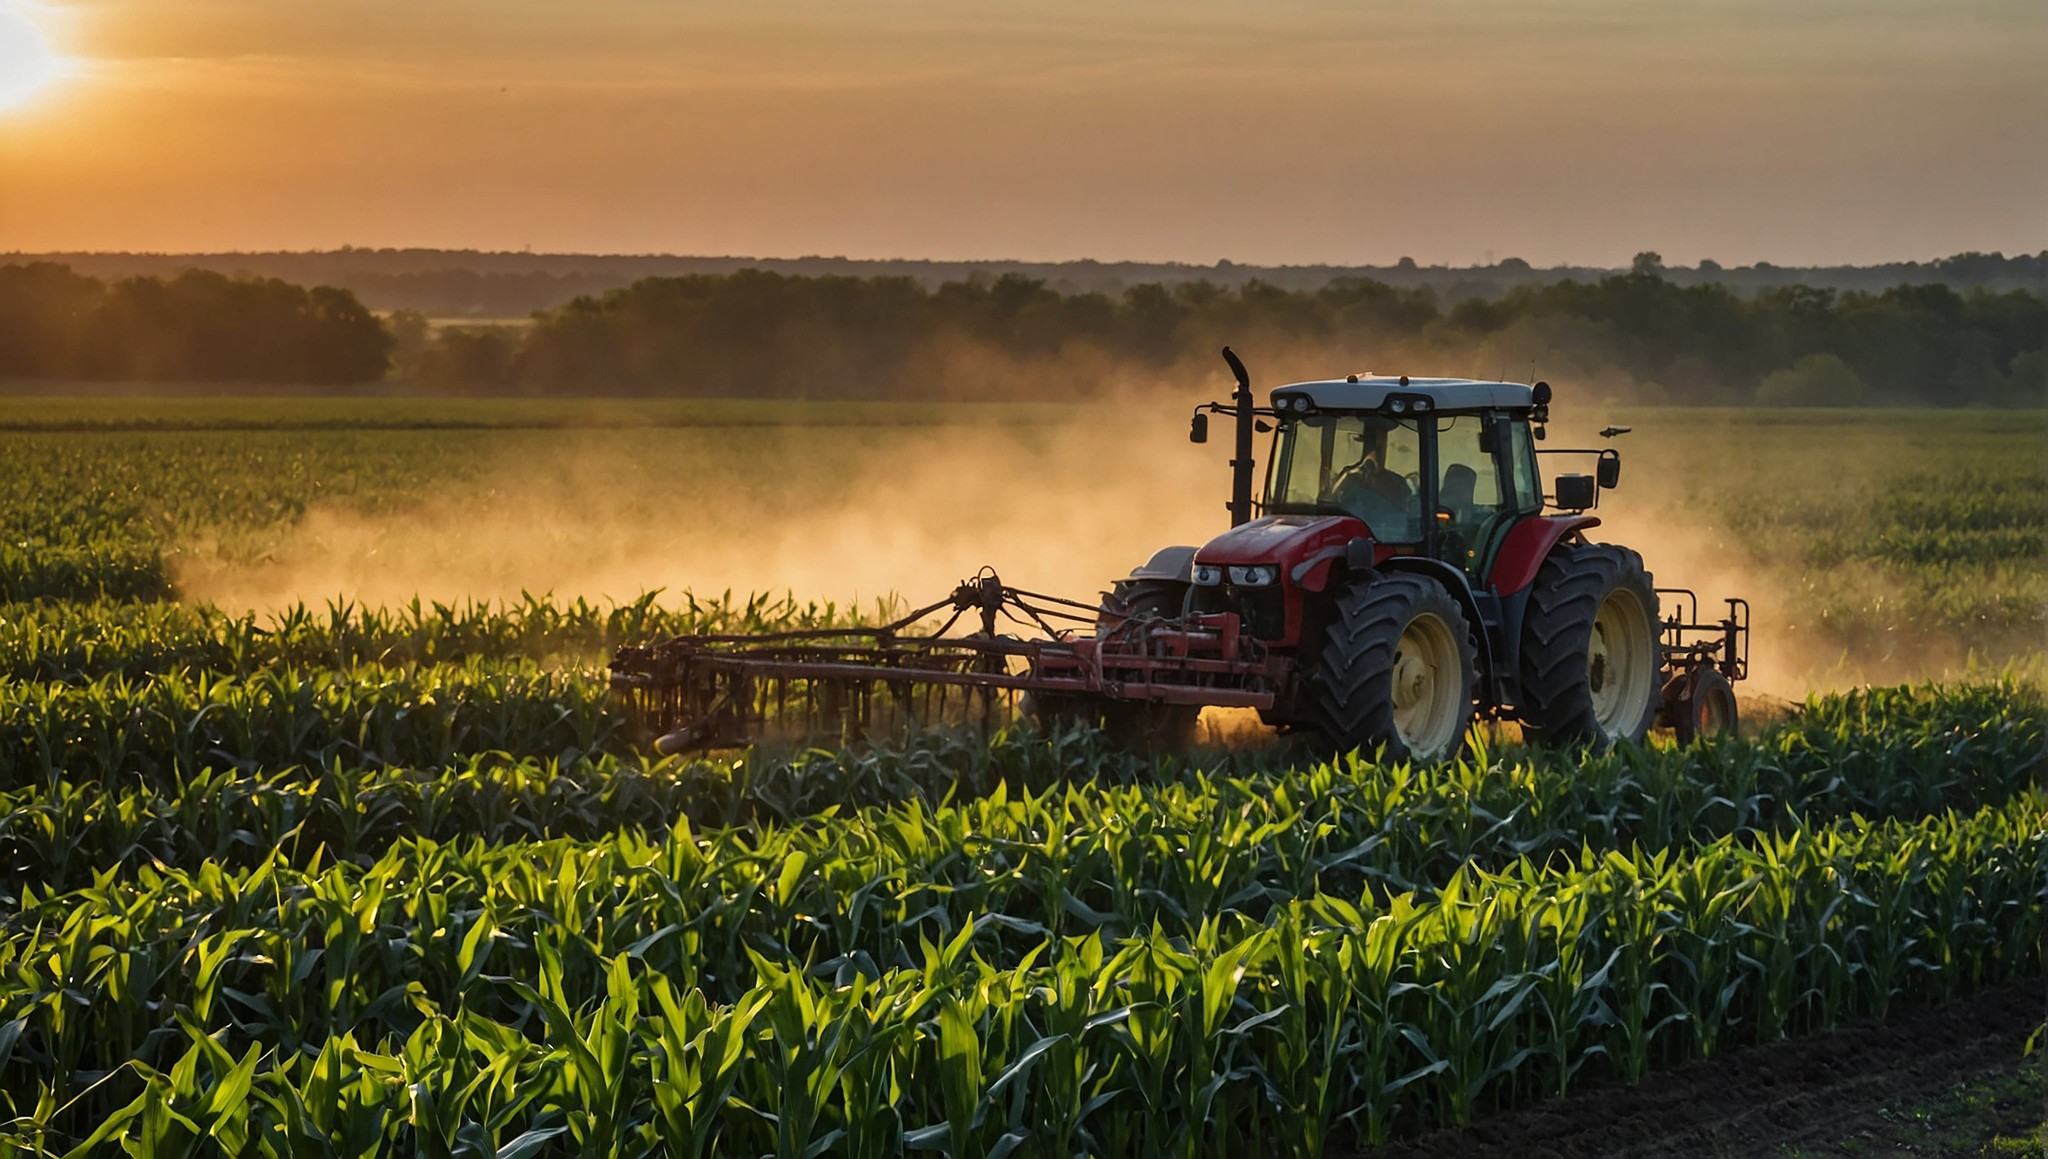
Innovative Solutions for agriculture

What NDVI Analysis Reveals
NDVI (Normalized Difference Vegetation Index) uses near-infrared and visible light data captured by our multispectral drone to measure crop vigor across every acre. Healthy vegetation reflects more near-infrared light and absorbs more visible light. Stressed plants do the opposite. The result is a color-coded map where green zones indicate healthy crop canopy and red or yellow zones flag areas of concern.
This data reveals problems that are invisible from ground level or even from a truck cab — nutrient deficiencies, water stress, compaction damage, disease onset, and early weed encroachment. Catching these issues early means you can respond before they impact yield.
Key Benefits
✅ Early Stress Detection: NDVI maps reveal crop stress weeks before it becomes visible to the naked eye, giving you time to intervene with targeted inputs.
✅ Whole-Field Visibility: Instead of spot-checking a few rows, you get a complete picture of crop health across every acre in a single flight.
✅ Input Optimization: Use NDVI data to guide fertilizer, fungicide, and irrigation decisions. Apply inputs only where the crop actually needs them.
✅ Season-Over-Season Tracking: Compare NDVI maps across multiple flights to track crop development, measure treatment effectiveness, and identify persistent problem zones.


Frequently Asked Questions
How can we help you?
How much does drone scouting cost?
How much does drone scouting cost?
How much does drone scouting cost?
How much does drone scouting cost?
